
How Much Should I Spend On Google Ads?

New advertisers are usually not sure how much money they should invest into Google Ads.
The answer is not simple as that. It really depends on the industry you work in.
For example, people in Finance & Insurance industry are expected to invest more because that industry is extremely competitive.

In fact, there are more than $4 billion invested into keywords related to the Finance & Insurance industry.
However, the point of Google AdWords advertising is to earn money, not to spend which means you can keep burning money as long as you are making the profit.
But, don’t expect the profit in the first three months, at least. Advertisers usually start with a group of keywords, and as they spend money, they are adding negative keywords.
In negative keywords, you have to add those keywords that are not converting, and also, that are not relevant to you.
Spying: How Much Competitors Are Spending?
A good idea before starting to advertise is to spy competitors.
Fortunately, you don’t need to hire a hacker to break into competitors’ accounts because you have tons of different apps that will reveal all the secrets your competitors hide.
One of the most popular tools for spying competitors is SpyFu. Open the app, enter the URL of your competitor and press the enter key. I’ll show you how SpyFu works on Crazy Egg’s example.
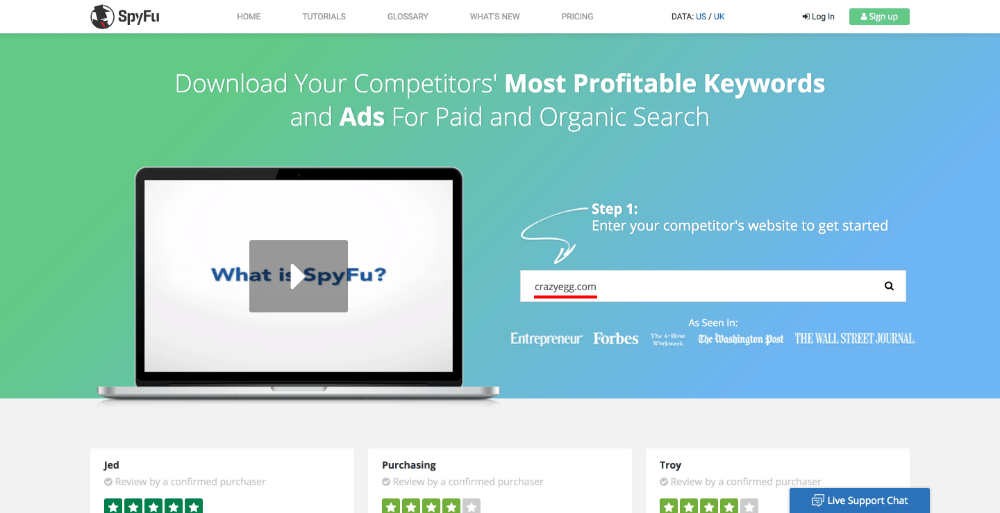
On the main screen, you can see not only AdWords data, but Organic Search too.
For example, you can see how many organic keywords the competitor rank for, how much those keywords are valuable and so on.
On the right side of the screen, there’s a section called Paid Search (Google Ads). For example, Crazy Egg picked 107 keywords which bring 797 monthly clicks.

According to SpyFu, Crazy Egg’s monthly Google Ads budget is $1,200. That means their average CPC is $1.50 (1200 ÷ 797).
Next, you can click on the number of paid keywords (107) which will move you to the screen that looks like this.
There, you can see the exact list of keywords that Crazy Egg bids.

This will allow you to learn more how your competitors advertise on Google and which landing page they use.
Next, you can click on Ad History tab which will exactly tell you how ads look like.

For example, you can learn what are the top ads, how they change over the time, and so on.
What’s more, you can see how much your competitors have invested in Google Ads in the last few years.
Do they invest even more or they stopped with Google Ads?
Business Model
The next step when it comes to Google Ads advertising, and generally investing the money in digital marketing, is to identify your business model.
E-commerce business models can be generally categorized in the following categories:
- Business-to-Business (B2B)
- Business-to-Consumer (B2C)
- Consumer-to-Consumer (C2C)
- Consumer-to-Business (C2B)
- Business-to-Government (B2G)
- Government-to-Business (G2B)
- Government-to-Citizen (G2C)
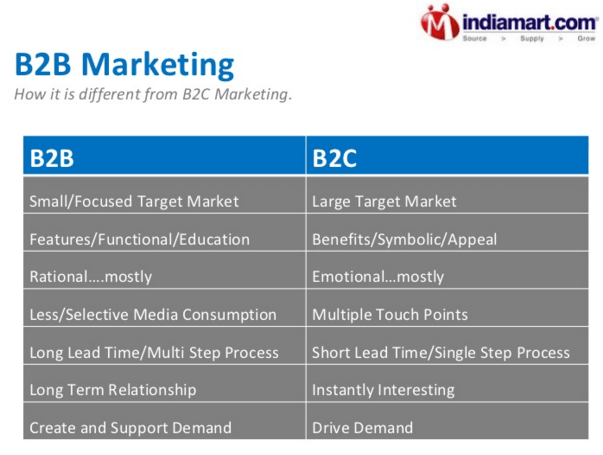
The two most popular business models are B2B and B2C.
B2B means that your customers are other businesses and B2C means that your customers are consumers. The following photo will show you differences between B2B and B2C.
If you have B2B then you’re probably familiar with the following two terms:
- Churn Rate
- Monthly Recurring Revenue (MRR)
- Customer Lifetime Value (CLV)
Although the three KPIs above can be applied in B2C model also, it’s just more appropriate for B2B. For example, B2C businesses usually track:
- Average Order Value
- Abandonment Rate
- CLV
Let’s explore these KPIs more.
Check Your Business KPIs
Again, KPIs are important because it makes no sense to advertise on Google Ads if you don’t know how much you make per order, how long does an average customer stays with you, and so on.
Now, let’s check which B2B metrics are must-have when advertising on Google. I’ll talk later about B2B metrics.
Imagine that you have created a SaaS company and you’re selling subscriptions. You probably have a few plans:
- Small plan ($49/mo)
- Medium plan ($99/mo)
- Large plan ($149/mo)
Majority customers will probably pick a medium plan, but anyway, you need to calculate ARPC - Average Revenue Per Customer.
Here’s the formula.

This will tell you much does an average customer pay you each month.
Next, you need to calculate Churn Rate - the percentage of people who cancel a subscription. The formula is pretty simple.

Finally, we came to the point. Once you know ARPC and Churn Rate, you can easily calculate a CLV - Customer Lifetime Value.
Let’s say that you each customer pay you $100 every month, and around 1.25% customers leave you each month. That means your CLV is $8,000 (100 ÷ 0.0125 = 8,000).

Having a CLV of $8,000 means that you can spend even $7,500 on acquiring a new customer, and you’ll still make a profit of $500.
If a click costs you $5 and every 300th click converts into customers, it means your CAC (Customer Acquisition Cost) is $1,500.

Or according to the formula above, if 1000 clicks cost you $5,000 and if it brings you 5 customers, it means your Customer Acquisition Cost (CAC) is exactly $1,000.
As long as your CAC is less than CLV, you can continue with Google AdWords. Remember, the point of Google AdWords advertising is to make the profit, not loss.
Now, let’s see what’s KPIs are for B2C businesses. The first metric is AOV (Average Order Value).
According to Statistia, an average order value of online shopping orders in the United States is $82.5 (Q1 2017).

It makes no sense to spend $300 on acquiring a new client when an average order value brings $82.5 in revenues, for example.
Here’s how it looks to calculate it.

Additionally, you should count on gross profit too (there’s difference between revenue and profit).
The good thing about online stores is that customers sometimes return too, which means calculating CLV is must-have. Here’s how to do it.

Simply said, if an average order value of your online store is $50 and an average customer buys three times per year while having an average lifetime of 5 years, then your CLV will be $750. Abandonment rates are the biggest problem in retail.
It’s well-known that an average abandonment rate is about 70%.

Did you know that? 10 customers add a product to the cart, and only 3 of them complete the order.
The reasons why that happens are different. Unexpected shipping costs is the first problem.

After that, creating a new user account is what users are bored about.
You can avoid it by allowing users to register by using their Facebook or Google account.
That should help a lot.
Find Out an Average CPC
Once you know your CLV you should think about Cost-per-Click (CPC). CPC depends on a lot on the industry you work in. According to WordStream, the Legal industry is the most expensive one!
On the other side, when offering B2B services you should expect to pay about $1.64 per click.

When you bid $1.00 you usually don’t pay that amount. That is only the highest amount you're willing to pay for a click.
Your average CPC is just a number calculated by dividing the total cost of your clicks by the total numbers of click. The final amount you pay per click is called actual CPC.

The photo above explains how Actual CPC is calculated. So, in order to pay less per click, you have to optimize a Quality Score.
Things are more complicated when calculating Ad Rank because Google changes its algorithms all the time.
It’s not just multiplying Max Bid and Quality Score, but anyway, the photo above perfectly helps you to understand what’s behind the scenes.
Optimize CPC: Increasing Quality Score
Before you start advertising, you should always track a Quality Score. Quality Score is a metric invented by Google which estimates the quality of your ad and landing page.
Google wants to provide the best search results (including paid ads) to its users. For that reason, they need to estimate how quality is your ad and landing page to its users.
There are three factors that have an impact to Quality Score:
- Expected CTR
- Ad relevance
- Landing page experience
Quality Score metric is available in Keywords tab. If you don’t see it, then you should customize columns and add the column.

If you’re wondering what is an average Quality Score, the answer is 5, according to WordStream.
How important is to optimize a Quality Score shows that increasing a QS from 5 to 6 should result in 14.3% in savings.

1 point QS increase can save you lots of money, especially when you invest huge amounts.
Here are few tips how to optimize a Quality Score.
Use SKAG
Within Ad group, you can add lots of keywords, but Google recommends that you should add up to 20 keywords per Ad group.

Some digital marketers follow SKAG tactic. SKAK stands for Single Keyword Per Ad Group which means that you add only one keyword per Ad group.
Why?
Within Ad group, you don’t only pick keywords because that’s where you also create different ads. That way, you’re able to create an ad that contains picked a keyword, so your targeted keywords will be bold.
Furthermore, if can mention a picked keyword somewhere on the landing page. As the result, your landing page, keyword, and the ad will be relevant to each other.
Check The Website Speed
Amazon experiences a decrease of 1% in conversions for every additional 100 ms load time. Loading speed is very important and you can check your site on tools like Pingdom.
In the search box, enter the URL, pick a location that you want to test from, and click on START TEST.

Within a couple of seconds, you’ll see how fast your website. For example, I can see that Jellymetrics.com is faster than 89% of tested sites on Pingdom.

That’s great to know, but also, there are other tools such as Google PageSpeed Insights where you can test your site. Imagine that you sell clothes on the Internet, and before you decide to advertise on Google Ads, it seems a good way to check site speed for every single product.
You can do that by using Google Analytics. In the menu, click on Behaviour - Site Speed - Overview.

There, you’ll see something like this.

As you can see, there will be page load time in seconds, the number of PageSpeed Suggestions, and PageSpeed Score.
There’s a strong correlation between conversion rates and site speed. It makes no sense to advertise on Google Ads if your site is very slow. You shouldn’t spend even a $1 if your site is extremely slow!
Use Negative Keywords
Some keywords convert great and some keywords don’t convert at all. The good news is that you can see all keywords that trigger your ad by clicking on Search Terms.

There, you’ll see how many clicks each keyword has, how many impressions, what’s an average CPC, and so on.

With two clicks, you can remove broad keywords that don’t convert.
This is how you improve a Quality Score. Of course, there are other ways, so I suggest you read our article about Quality Score optimization.
Conclusion: How Much To Spend On Google Ads?
In my case, the correct answer would be: Invest as much as possible as long as you make more money than you lose.
Give it a try for at least three months because it will take some time to understand which keywords and products make the money. The purpose of Google Ads is to make the profit. Start with a small budget and increase it over the time while you’re adding negative keywords.
Finally, don’t forget to measure CLV because it tells you how much space you got. It’s not the same when your business has a CLV of $1,000 with an average click of $1 and a CLV of $500 with an average click of $2. Good luck!